
Tuesday, December 19, 2023
Proxmox monitoring

A toolset to gather temperature and power consumption metrics then collect in Prometheus. Can be found on GitHub https://github.com/jaroslawhartman/proxmox-monitoring/tree/main
Architecture
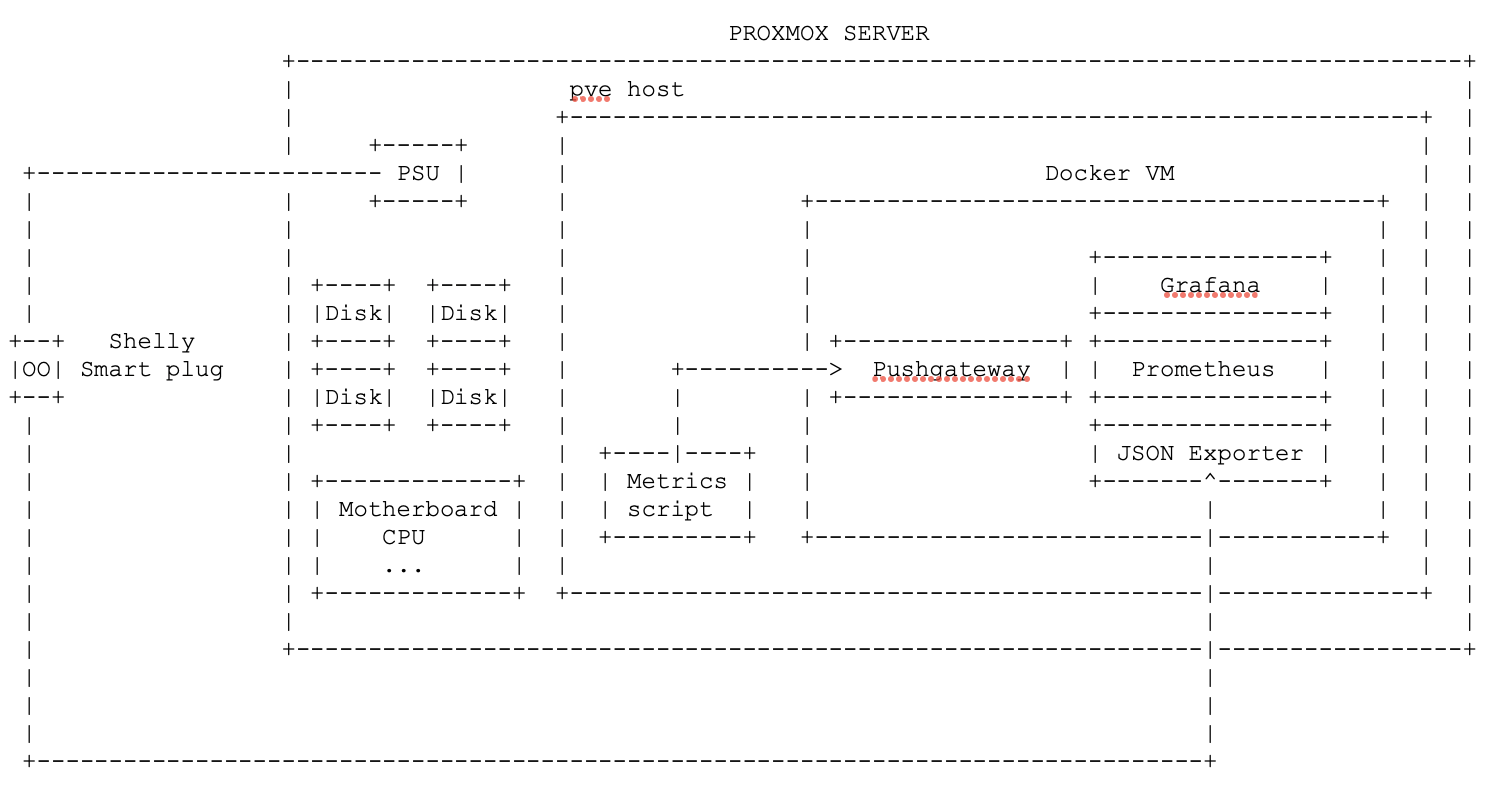
Components
- Proxmox Server 8.1.3
Host
Collecting script is running every minute on the pve host
* * * * * /root/scripts/temperature.sh > /dev/null 2>&1Temperature of the disks (SSD and HDD) and CPU&MB collected by a bash script invoking smartctl and sensors. After parsing and formatting the sample is pushed to Prometheus Pushgateway.
Monitoring VM
Other monitoring components are installed as Docker containers insiide a VM.
- Shelly Smart Plug with power meter capabilities
https://www.shelly.com/en/products/shop/shelly-plus-plug-s
Power consumption can be gathered using a REST request:
curl http://192.168.3.154/meter/0

{
   "power":86.46,
   "overpower":0.00,
   "is_valid":true,
   "timestamp":1703015868,
   "counters":[
      88.916,
      89.196,
      88.723
   ],
   "total":4928769
}
Prometheus
Queries:
# Power consumption
power

# Temperature CPU & MB
temperature{job="temperature_cpu"}

# Temperature Disks
temperature{job="temperature_disk"}